A healthcare operations case where a diagnostic lab receives enough volume, but lacks visibility into where SLA breaches, delays, rework and bottlenecks are actually happening.
The lab has enough volume. What it lacks is operational visibility.
A diagnostic laboratory network receives stable sample volume, but management does not
have a clear view of where delays, rework, backlog pressure and SLA breaches are happening.
Overall SLA compliance looks relatively stable, but that average hides recurring pressure
in complex diagnostic workflows, validation queues and reworked samples. The challenge is
not simply to report KPIs. The real question is where management should act first.
40,000clean sample records200,000stage-event records39,601valid released samples87.5%overall SLA compliance
Dashboard story
Four pages, four different management questions.
Each page earns its place by answering a different operational question. The dashboard
moves from executive visibility to workflow risk, bottleneck diagnosis and targeted action.
Dashboard page
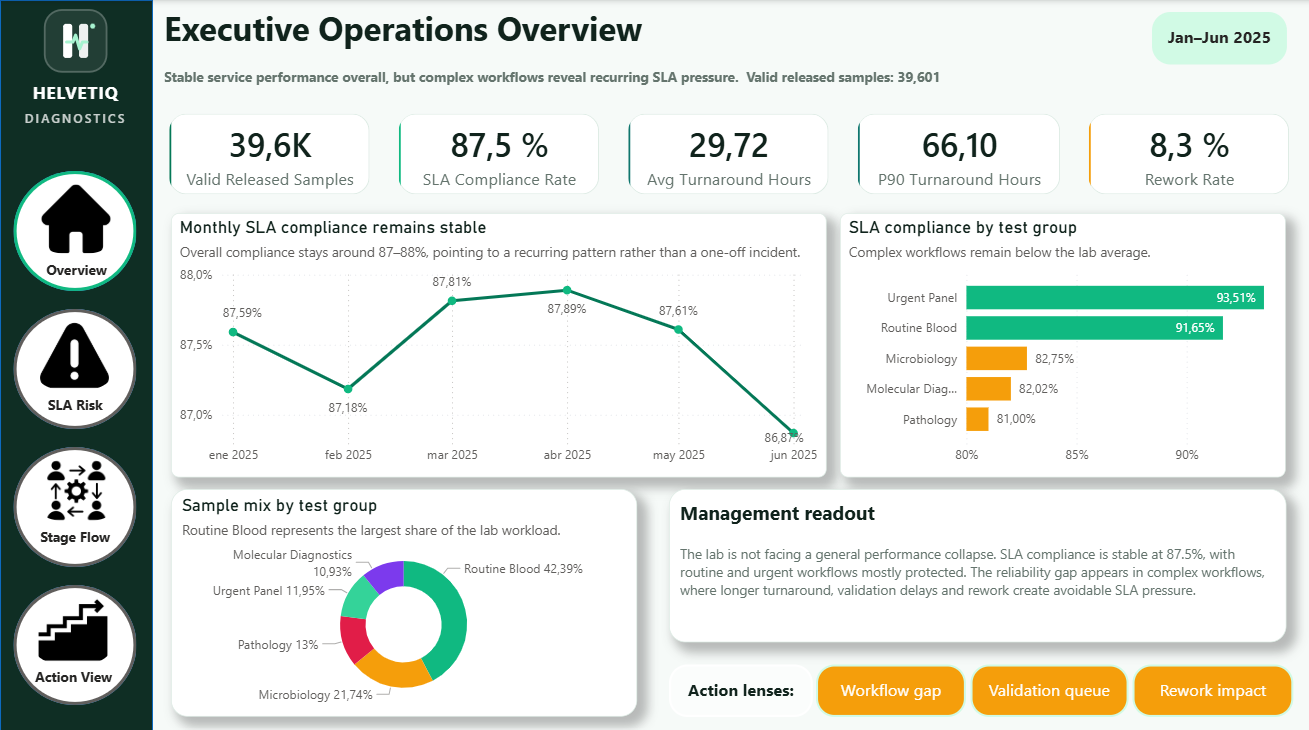
Executive Operations Overview
The front-door view for management: overall SLA stability, workload mix, test-group performance and the first executive readout.
Key readThe lab is stable overall, but complex workflows reveal recurring SLA pressure.
Page 1
Executive Operations Overview
Is the lab meeting service expectations overall, and where is reliability risk visible at a high level?
The lab is stable overall, but complex workflows reveal recurring SLA pressure.
Page 2
Workflow & SLA Risk Concentration
Which workflows deserve management attention because they combine breach volume, weak SLA performance and long turnaround tails?
Routine Blood has volume exposure, while complex workflows carry more actionable risk exposure.
Page 3
Bottleneck & Stage Flow Analysis
Where inside the sample journey is turnaround time being lost, and which part is actually actionable?
Testing consumes process time, but validation creates the clearest avoidable waiting signal.
Page 4
Rework & Site Quality Action View
Which quality issues should management act on first, and where should those actions be targeted?
Rework is small in volume but large in SLA impact, and site-level patterns help target action.
Technical foundation
Built on validated sample-level and stage-level operational data.
The reporting model is based on two core fact tables:
fact_samples, with one row per diagnostic sample, and
fact_stage_events, with one row per sample-stage event.
Supporting dimensions include test group, priority, department, site and date. The clean
layer preserves 40,000 diagnostic samples and 200,000 stage events, with 39,601 samples
valid for released-sample SLA reporting.
Power BISQLPythonPandasSQLitePower QueryDAXOperational AnalyticsHealthcare AnalyticsSLA ReportingData Quality
01
Raw operational data
Sample-level and stage-level data covering diagnostic workflows, priorities, sites, timestamps, SLA targets, rework and quality flags.
02
Data quality checks
Duplicates, missing timestamps, invalid stage durations, SLA target gaps and status conflicts were identified before creating reporting tables.
03
Clean analytical model
Created fact and dimension tables for samples, stage events, dates, sites, departments, priorities and test groups.
04
SQL KPI validation
Core KPIs were reproduced through SQL before dashboarding: SLA compliance, breach volume, P90 turnaround, queue time and rework impact.
05
Power BI executive reporting
Built a four-page dashboard focused on management visibility, bottleneck diagnosis and targeted action prioritization.
Key findings
The analysis separates stable operations from targeted reliability risk.
01
The lab is not failing overall.
SLA compliance is stable at 87.5%, and routine / urgent workflows are mostly protected.
02
SLA risk is concentrated.
Pathology, Molecular Diagnostics and Microbiology repeatedly sit below the lab average.
03
Validation is the actionable bottleneck.
Testing naturally takes time, but validation queue is where avoidable waiting becomes visible.
04
Rework has disproportionate impact.
Reworked samples represent 8.3% of volume but account for 28.9% of SLA breaches.
What this project demonstrates
Data Analyst work with business judgement.
KPI logic
Defined and validated SLA compliance, breach volume, turnaround, P90 tail risk, rework impact and queue-time metrics.
Operational diagnosis
Separated volume exposure from performance risk, and separated process duration from avoidable waiting.
Management reporting
Designed Power BI pages around decisions: what is happening, where risk sits, where time is lost and what action to prioritize.
Portfolio positioning
Why this case matters for Swiss Data Analyst roles
This project adds a healthcare / MedTech-adjacent operational analytics case to my portfolio.
It shows practical work with KPI reporting, data quality checks, SQL validation, Power BI
storytelling and process visibility in a regulated, service-heavy environment.