Structured to show finance-oriented analytical thinking rather than generic BI output.
Finance / FP&A / Controlling
Finance Data Foundation for FP&A and Controlling
A finance-focused analytics project built to demonstrate source-to-target logic, variance thinking, reconciliation controls, and stakeholder-facing reporting through a recruiter-ready Power BI suite.
Combines transformation logic, finance data modeling, and stakeholder-facing dashboards.
Designed to support overview, diagnosis, control, and management interpretation.
Project overview
More than a dashboard layer.
This project was designed as a finance data foundation first and a reporting layer second.
The objective was to build something that feels closer to how FP&A, controlling, and finance transformation work in real business settings: structured inputs, clear reporting logic, and outputs that support explanation, accountability, and decisions.
Rather than presenting only polished visuals, the project emphasizes what sits underneath: source handling, standardized layers, planning logic, reconciliation thinking, and a reporting structure aligned with stakeholder needs.
What this project is meant to signal
- Enterprise-style thinking around finance data structure
- Comfort with reporting logic, controls, and variance interpretation
- Ability to translate data foundations into stakeholder-facing dashboards
- Business-facing communication rather than purely technical output
Dashboard suite
Four pages, four layers of finance visibility.
The suite is structured so that each page plays a different role in the reporting experience: executive overview, variance diagnosis, reconciliation confidence, and KPI drivers.
Page 1
FP&A Executive Overview
A high-level executive page designed to provide immediate visibility into core performance, monthly movement, and business cuts relevant for FP&A and controlling stakeholders.
Page 2
Variance Analysis
A diagnostic layer focused on budget vs actual, trend context, and structured interpretation of where performance diverges and why.
Page 3
Reconciliation & Reporting Controls
A control-oriented view built to show reporting consistency, reconciliation logic, and confidence in the underlying finance data foundation.
Page 4
Management KPI Drivers
A management-facing page focused on KPI movement, operational drivers, and the translation of finance data into clearer decision support.
Architecture
From raw extracts to finance-facing reporting.
The value of the project comes from the full chain: ingestion, standardization, finance logic, planning context, curated outputs, and reporting consumption.
Raw finance extracts
Contoso Retail DW extracts landed as parquet to preserve source fidelity and support traceable downstream transformations.
Standardized actuals layer
Actuals were cleaned, standardized, and enriched to create a consistent analytical base suitable for finance reporting logic.
Account-line and monthly FP&A base
Finance-specific modeling created account-level and monthly structures designed for P&L analysis, reporting, and control workflows.
Budget, forecast, OPEX, allocation logic
Planning layers were generated to support variance analysis, management visibility, and comparison against actual performance.
Reporting-ready finance facts
Curated outputs such as P&L monthly facts and reconciliation tables were prepared for stakeholder-facing reporting consumption.
Decision-facing reporting layer
The final dashboard suite translated the finance data model into executive, diagnostic, and control-oriented reporting views.
What this demonstrates
Why this project matters professionally.
The project is designed to position my profile for finance-facing analytics roles where data structure, business interpretation, and reporting confidence all matter.
Finance framing
Built for FP&A and controlling credibility
The project is structured to signal that the work goes beyond dashboard decoration and into finance-oriented analytical thinking.
Technical depth
Data logic before visuals
The reporting layer sits on top of transformation logic, reconciliation thinking, and structured source-to-target design.
Stakeholder focus
Reporting designed for use
Each page was built around how different finance stakeholders consume information: overview, diagnosis, control, and drivers.
Tools and concepts
DuckDBParquetPower BIFP&AControllingVariance AnalysisReconciliation LogicSource-to-Target MappingFinance ReportingBusiness-Facing Analytics
Next step
Interested in the finance case study?
This project is part of a broader portfolio focused on applied analytics, business visibility, and decision-support systems.
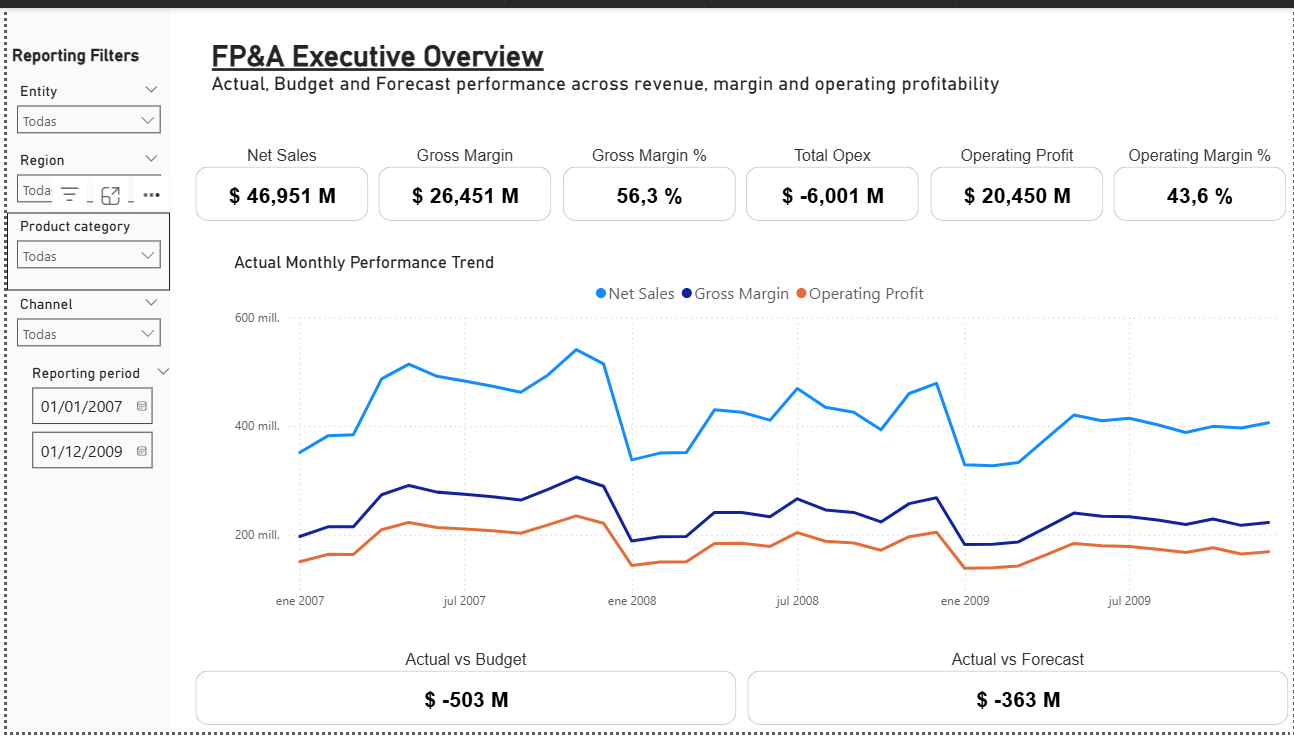
FP&A Executive Overview
A high-level executive page designed to provide immediate visibility into core performance, monthly movement, and business cuts relevant for FP&A and controlling stakeholders.