Manufacturing / Operations Controlling & Cost-to-Serve
A management-facing controlling case built around a harder profitability question: where reported margin overstates real value once setup effort, fragmentation, fulfillment burden, service support, and scarce capacity are treated as part of the decision.
I built this project around a familiar management blind spot in manufacturing: reported margin can look good enough while the operation is quietly carrying too much setup effort, too much fragmentation, too much fulfillment burden, and too much capacity strain.
The case is not a generic KPI dashboard. It is a controlling story about where standard profitability overstates real value, which products are creating hidden leakage, which ones behave like capacity hogs, and what management should actually do first.

Profitability only becomes useful when margin and operational burden are read together.
Why standard margin was not enough
The question of business this page responds to is: why can’t management rely on the usual product margin view to decide what to protect, scale, or challenge?
The real management problem
A product can look acceptable in reporting and still be economically weaker than it seems.
In this case, the issue was not revenue visibility. It was decision quality. Standard margin told part of the story, but it ignored the operational burden attached to certain products and variants.
That is where management can make the wrong call: protecting products that appear healthy while they quietly absorb scarce setup time, fragmented production effort, awkward fulfillment work, support attention, and valuable capacity.
Why the usual view breaks down
- Standard gross margin gave management a directional view, but not a decision-useful one
- Operationally awkward products could still look acceptable because setup, fragmentation, and support effort sat outside the usual product view
- That created a real risk: protecting or scaling products that absorbed scarce capacity without creating equivalent economic value
- The business needed product-level prioritization, not another page of generic manufacturing KPIs
What I actually built
The project is best understood as a decision-support case for management and controlling, not as a dashboard built for its own sake.
Profitability gap view
A first page that deliberately contrasts reported margin with a more realistic economic contribution view once cost-to-serve is layered in.
Leakage driver diagnosis
A second page that surfaces which products are carrying hidden operational leakage and which burden drivers are actually doing the damage.
Capacity drag diagnosis
A third page that treats scarce operational capacity as a management constraint, not as background noise, so capacity hogs become visible even when margin looks passable.
Action prioritization
A final page that converts diagnosis into differentiated action paths instead of assuming every weak product deserves the same response.
The cost-to-serve logic behind the case
The question of business this page responds to is: what sits between reported margin and real economic contribution, and why does it matter for decision-making?
How the case reframes profitability
I structured the case around a product-level cost-to-serve lens that does not pretend every item carries the same operational burden. That creates a more realistic economic view than margin alone.
The goal was not to force accounting precision where it does not belong. The goal was to make hidden operating burden visible enough for management to prioritize better.
Key burden dimensions layered into the analysis
- Setup effort and changeover burden
- Production fragmentation and low-flow operational complexity
- Fulfillment burden created by awkward order and shipment patterns
- Service and support load after the sale
- Capacity strain, where resource consumption matters as much as nominal margin
The 4-page decision flow
The question of business this section responds to is: how does the report move from diagnosis to decision support without repeating the same story four times?
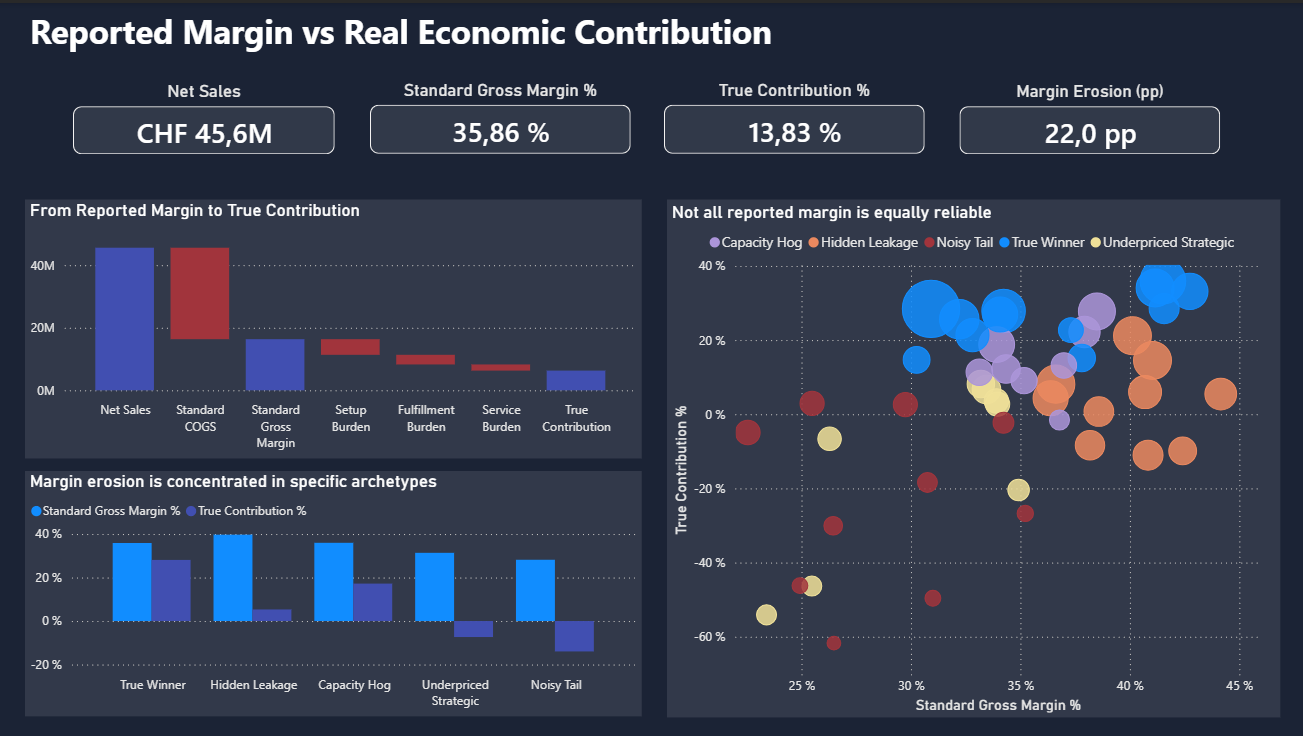
1. Reported Margin vs Real Economic Contribution
The first question the case answers is simple but important: which products look profitable on paper, yet become far less attractive once operational burden is treated as part of the economics? This is the page that creates tension in the story.
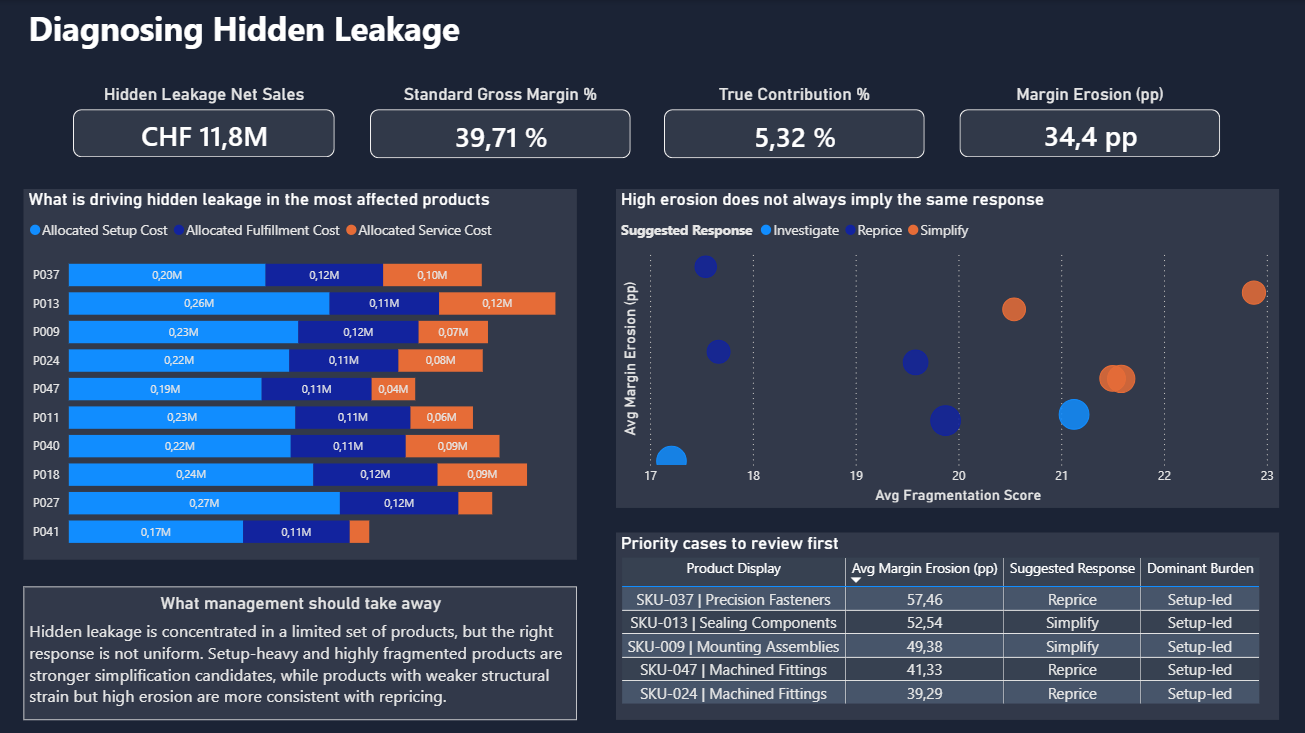
2. Diagnosing Hidden Leakage
Once the profitability gap is visible, management needs to know why it exists. This page isolates the products creating the biggest hidden leakage and shows whether the erosion comes from setup intensity, fragmented flow, fulfillment burden, service support, or a combination of drivers.
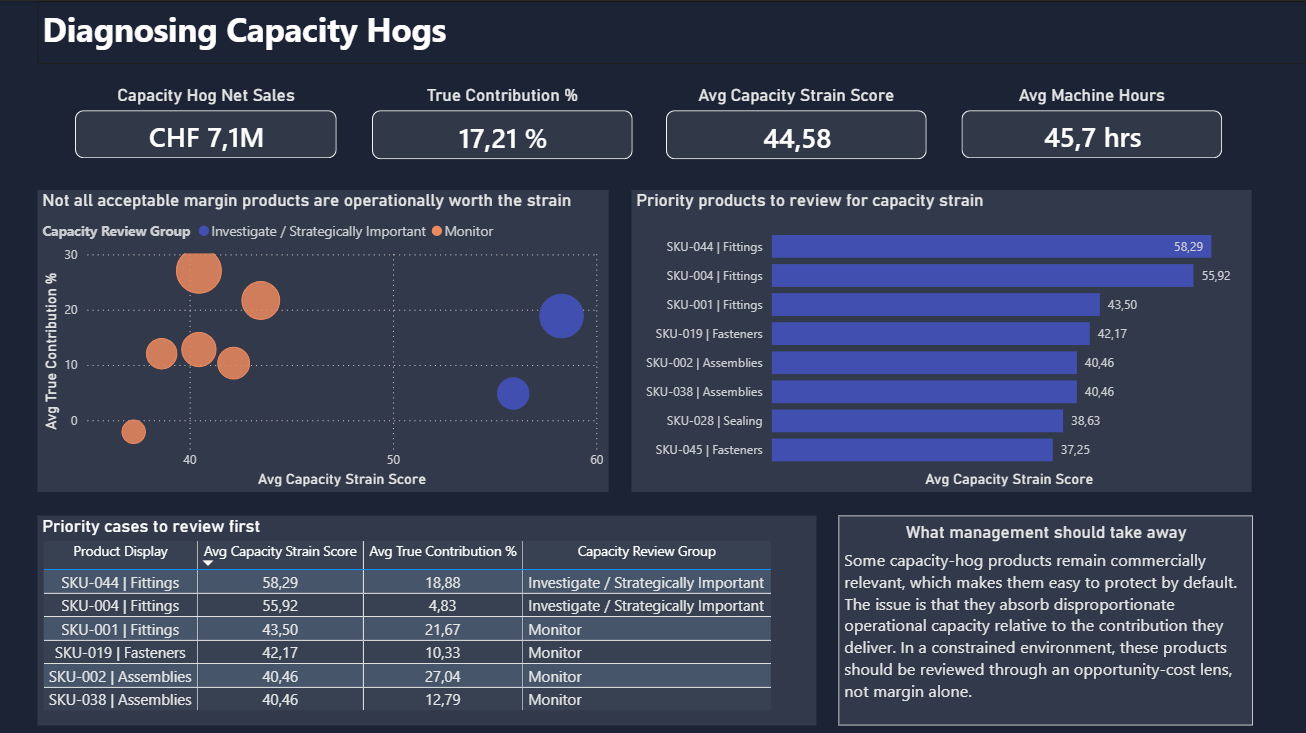
3. Diagnosing Capacity Hogs
Some products do not look disastrous on standard margin, yet they absorb a disproportionate share of scarce operating capacity. This page makes that trade-off visible so management can stop confusing acceptable margin with efficient value creation.
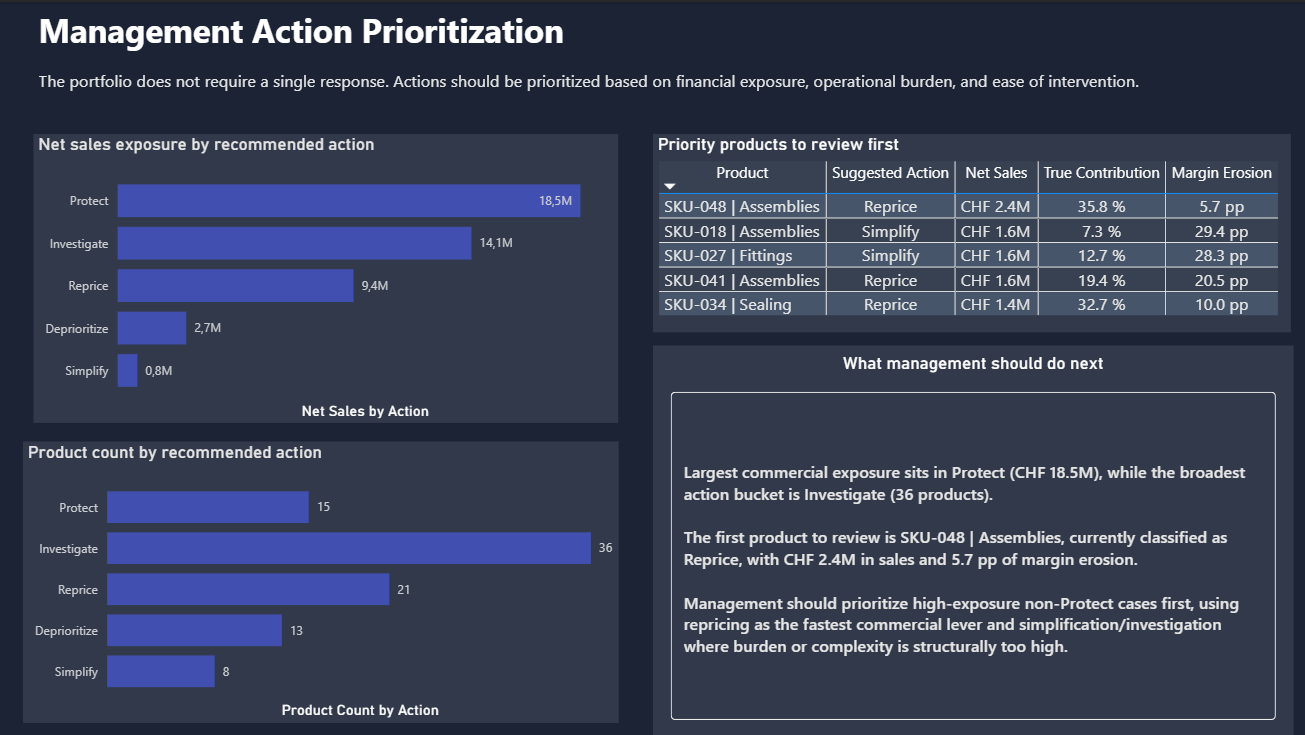
4. Management Action Prioritization
The final page turns diagnosis into management action. Products are not all treated the same. Some deserve protection, others repricing, others simplification, deeper investigation, or deliberate deprioritization. That is the decision-support layer the earlier pages build toward.
Why the last page matters most
The question of business this page responds to is: once the weak points are visible, what should management do first?
The final page exists to help management choose the next move, not just to admire the diagnosis.
How the actions are differentiated
Not every problematic product should be treated as a candidate for elimination. Some deserve repricing because the burden is real but the offer is still strategically relevant. Some deserve simplification because the value is being eroded by avoidable complexity. Some deserve investigation because the signal is strong enough to warrant management attention but not yet clean enough for a hard decision.
And some products should simply be protected. That matters because a serious case is not built around hunting bad news. It is built around better prioritization.
Tools used
The stack was kept practical and business-oriented: enough technical depth to make the logic credible, without turning the case into a data-engineering showcase.
Power BI
SQL
Python
Excel / Power Query
Analytical data modelling
Management reporting logic
Why this project matters in the portfolio
For Swiss recruiter-facing positioning, this project strengthens the part of my profile that sits between analytics and business control: structured problem framing, financially literate reasoning, operational awareness, and management-facing reporting.
The case shows that I can frame a real controlling problem, not just assemble a report around available fields.
It demonstrates business-facing analytics that connect profitability, operational burden, and management action in one coherent story.
For recruiter-facing positioning, it strengthens my fit for FP&A, controlling, reporting, and decision-support roles where finance logic and operational reality need to be read together.
Next step
Want to explore more of the portfolio or get in touch?
You can go back to the selected projects section or contact me directly by email.